
County Data Hub
Interactive maps depicting the percentage of People of Color (POC) compared to the Voting Age Population (VAP) of each county. The county reports details changes to district lines drawn since 2011 when the last significant redistricting was done following the 2010 Census. The data paired with the local redistricting policy toolkit is a robust set of tools to create progress at the local level.
By County Commission
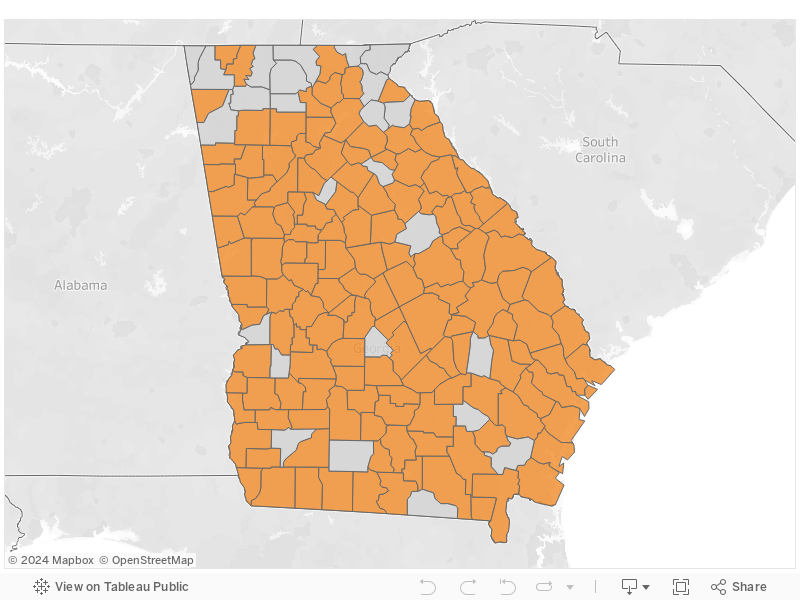
By School Board

*The interactive maps above are not representing VRA claims. The “Majority POC districts” we have described only resemble what a majority POC district could be based on population percentage alone.
County Population - CCSB Analysis
Jump down Alphabetically: